
Kardashev index
0.391
Based on primary energy power · Type I = 1
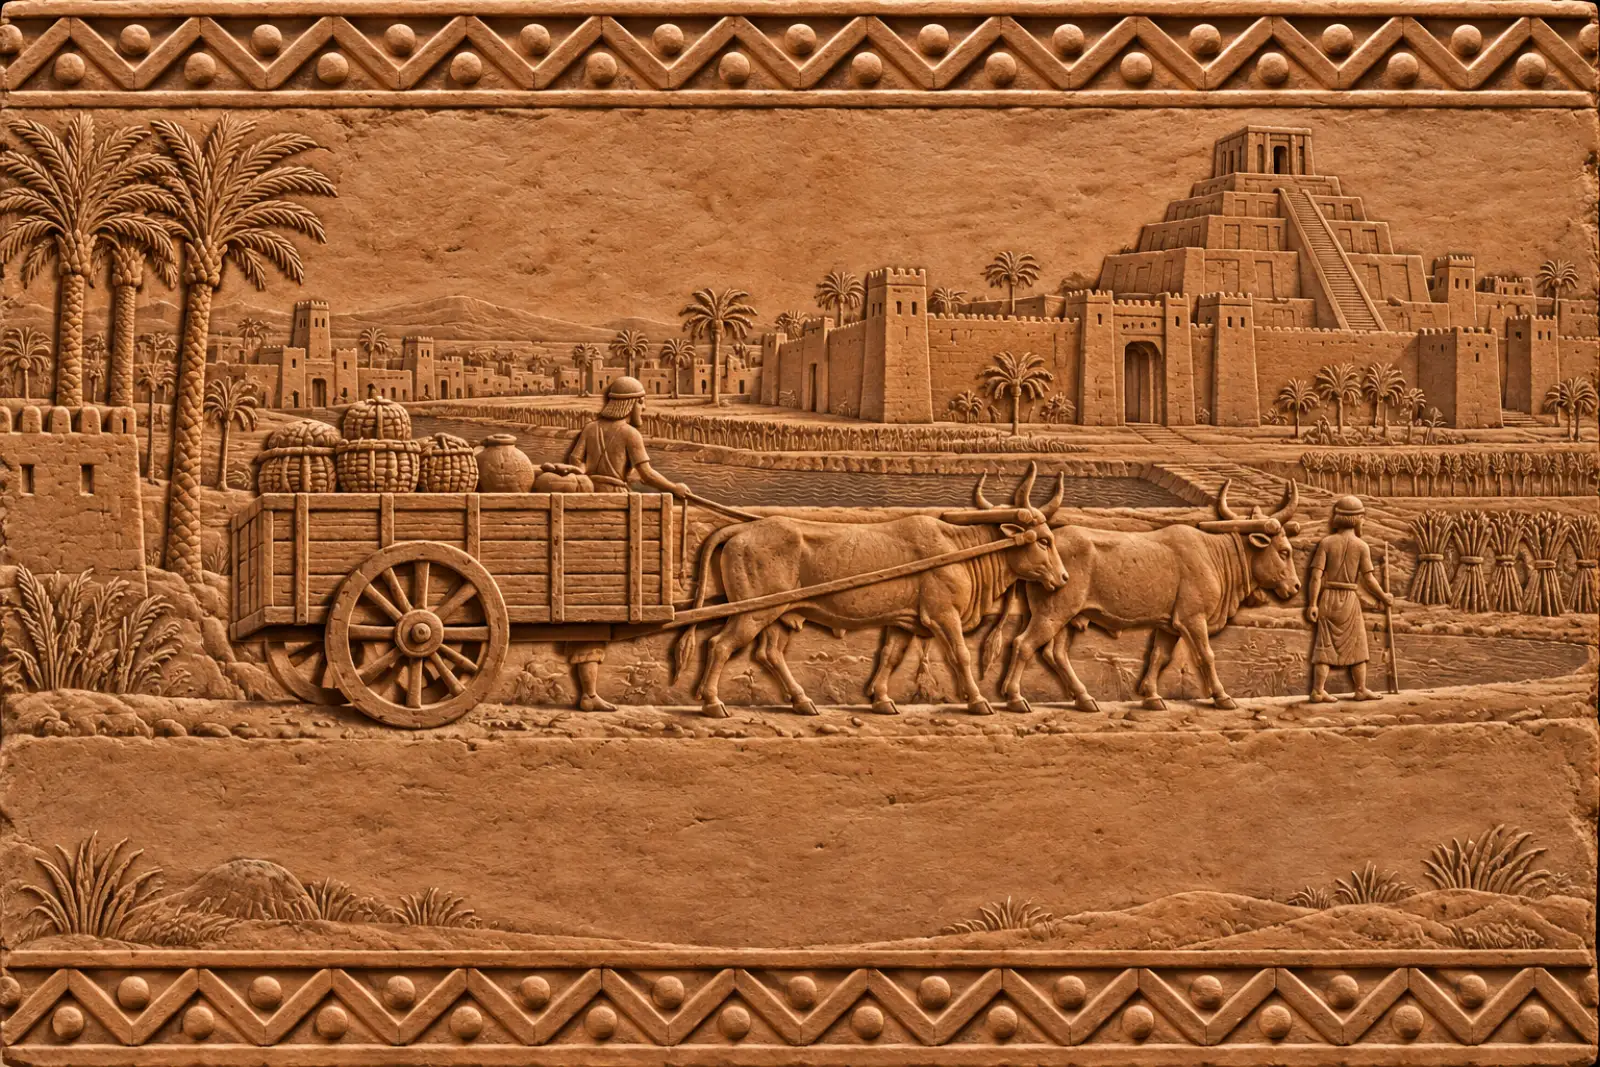
AccelerationFour-dimensional view5,526 years agoCities and Writing
By around 3500 BC, wheels were recorded in use in Sumer.
Art style · Sumerian clay-tablet relief
Each sparkline shows the documented history of a metric on a logarithmic time axis. The dot marks the selected moment.
0.391
Based on primary energy power · Type I = 1
35.88Mpeople
1/233 of today
8.1×10⁹W
1/2,504 of today
—
No reliable data yet · data begins 1945
—
No reliable data yet · data begins 1620
48km/h
1/831 of today
The eight closest milestones. Select a title to jump there.
From about 7100 BC, a large Neolithic settlement grew up in Anatolia. Source
By around 3500 BC, wheels were recorded in use in Sumer. Source
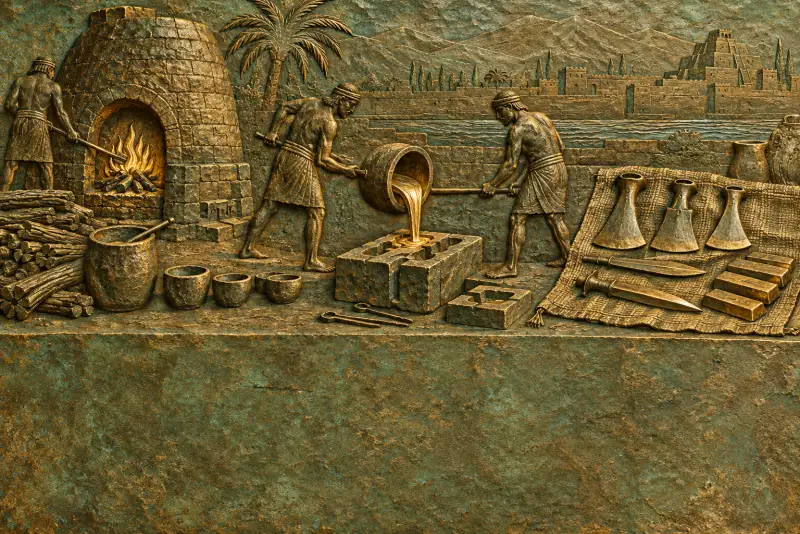
Around 3300 BC, the Near East entered the Bronze Age, bringing harder tools and weapons. Source
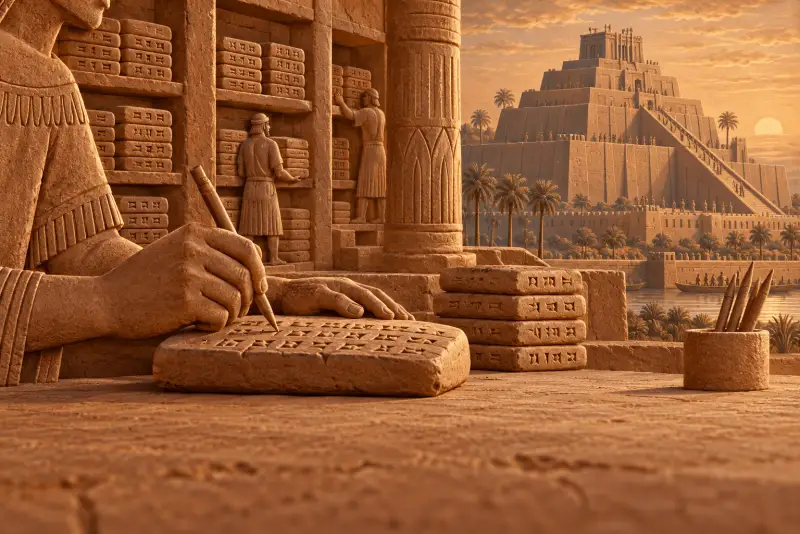
Around 3200 BC, the Sumerians began keeping records on clay tablets, developing the earliest known writing. Source
Completed around 2560 BC, it remained the tallest human-made structure for more than 3,700 years. Source
A written Babylonian law code carved on a stone stele, around 1753 BC. Source
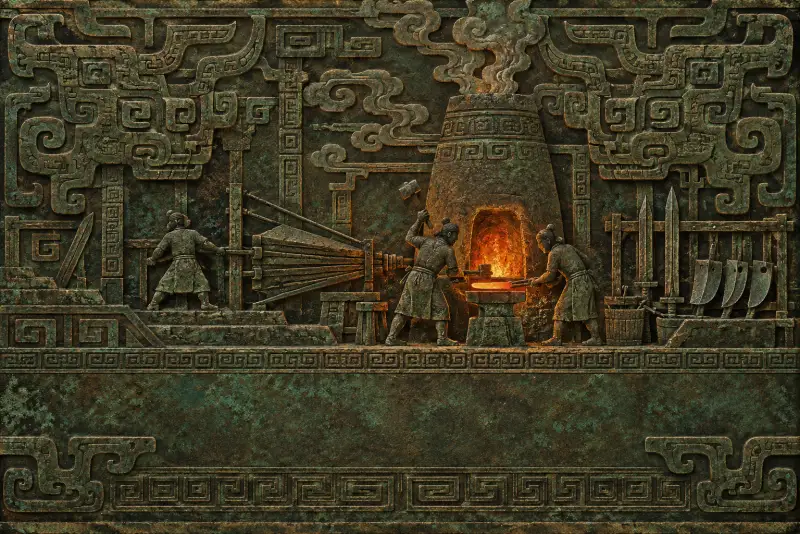
From around 1200 BC, ironworking spread and iron gradually replaced bronze. Source

A handful of letters could record speech sounds; it later gave rise to the Greek, Latin and other alphabets. Source
Acquired5 / 121 items
Each era illustrated in its own style.
Every timeline entry cites its source. Metrics interpolate logarithmically between sourced data points. Forecasts include institutional and community views, and attributed site scenarios; years are not guaranteed realization dates. Illustrations are AI-generated in each era's style.